Observability
Performance issues, errors, and exceptions are unfortunate events that may occur in a production environment. In order to identify an unfortunate event, observing the production environment is essential. The API Microgateway's observability feature supports monitoring and distributed tracing inorder to provide a clear picture of the performance of the Microgateway. The API Microgateway exposes a metrics endpoint which gives metrics related to service level data, client-side data as well as some process-related data such as memory and CPU usage. These metrics can then be fed into a monitoring toolkit such as Prometheus. In addition to this, we could configure an analytics dashboard such as Grafana to visualize the metrics generated by Prometheus. For tracing Jaeger or Zipkins could be configured.
How to enable the Observability
By default, the Observability feature is disabled. The feature can be enabled in one of the following ways.
Follow the steps below in order to enable the observability of API Microgateway by changing the configuration.
-
Stop the server if it is running.
-
Open the
<MGW\_runtime>/conf/micro-gw.confadd the below configuration. This enables metrics monitoring and distributed tracing on the server with default settings.
[b7a.observability.metrics]
# Flag to enable Metrics
enabled = true
reporter = "prometheus"
[b7a.observability.metrics.prometheus]
port=9797
jmx_port = 8080
secure_port = 9000

[b7a.observability.tracing]
# Flag to enable Tracing
enabled = true
name = "jaeger"
[b7a.observability.tracing.jaeger.reporter]
port=5775
Observability can be enabled by adding environment variables before starting the API Microgateway service.
export b7a\_observability\_tracing\_enabled=true
export b7a\_observability\_metrics\_enabled=true
Configure Prometheus
Before you start you have to create a user according to your preference in the configuration file. This user creation is essential to configure the Prometheus server.
Note
If you are only running tracing separately this user will not be in use.
Please find a sample configuration.
You can find the micro gateways configuration file in the path /MGW_runtime/conf/micro-gw.conf. The default configurations are as follows.
[b7a.users]
    [b7a.users.prometheus]
        password= "@sha256:{5e884898da28047151d0e56f8dc6292773603d0d6aabbdd62a11ef721d1542d8}"
        scopes= "observability"
Configure Prometheus on docker
-
Create a prometheus.yml file in /tmp/ directory.
-
Add the following content to /tmp/prometheus.yml.
global:
  scrape_interval:  15s
  evaluation_interval: 15s

scrape_configs:
  - job_name: 'Ballerina_Metrics'
    basic_auth:
      username: prometheus
      password: 'password'
    scheme: https
    tls_config:
      insecure_skip_verify: true

    metrics_path: /metrics

    static_configs:
      - targets: ['<user_IP>:9000']

  - job_name: 'JMX_Metrics'

    basic_auth:
      username: prometheus
      password: 'password'

    scheme: https
    tls_config:
      insecure_skip_verify: true

    metrics_path: /jmxMetrics

    static_configs:
      - targets: ['<user_IP>:9000']
Here the targets '<user_IP>:9000’' should contain the host and the secured port of the service which is given under secure port in [b7a.observability.metrics.prometheus]. Also, you need to give step 1 created username and password credentials under the basic_auth section.
We use tls config:insecure skip verify as true to skip the server certificate verification.
- Start the Prometheus server in a Docker container with below command.
$ docker run -p 19090:9090 -v /tmp/prometheus.yml:/etc/prometheus/prometheus.yml prom/prometheus- Go to http://localhost:19090/ and check whether you can see the Prometheus graph.
Configuring Grafana
Let’s use Grafana to visualize metrics in a dashboard. For this, we need to install Grafana and configure Prometheus as a data source. Follow the below-provided steps and configure Grafana.
-
Start Grafana as a Docker container with below command.
$ docker run -d --name=grafana -p 3000:3000 grafana/grafanaFor more information refer Grafana in Docker Hub .
-
Go to
<http://localhost:3000/>to access the Grafana dashboard running on Docker. -
Login to the dashboard with the default user, username: admin and password: admin
-
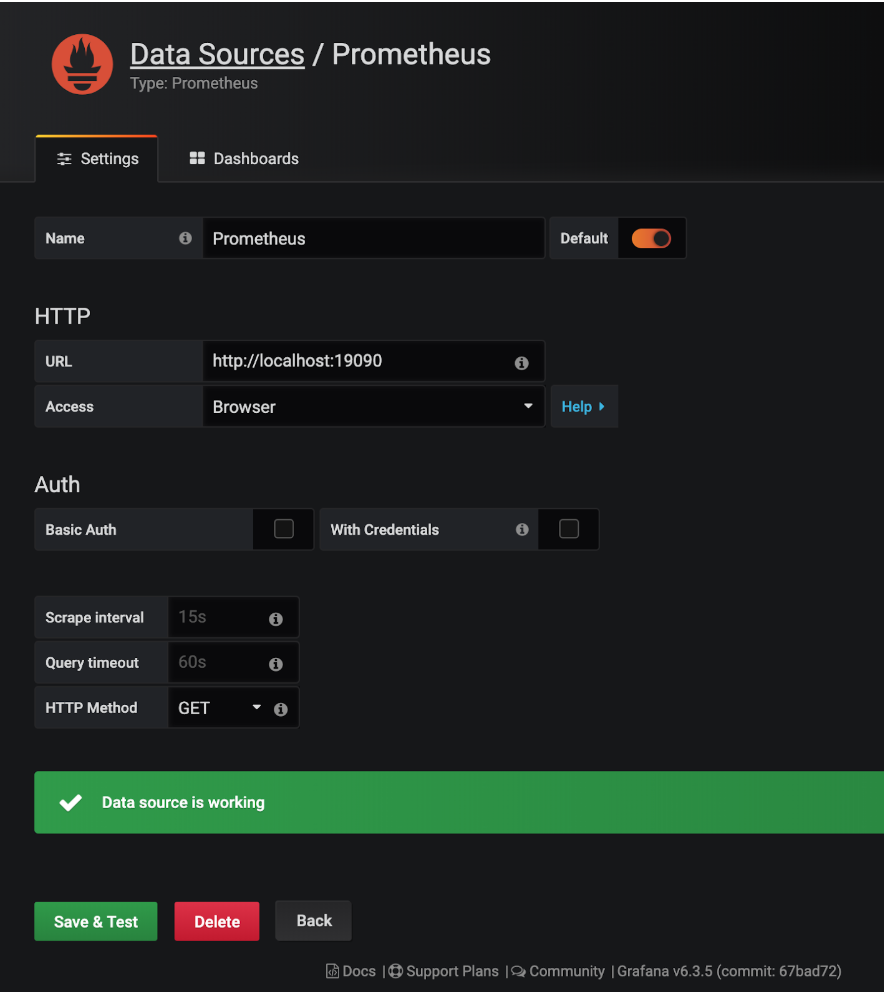
Add Prometheus as a data source with Browser access configuration as provided below.
-
Import the Grafana dashboard designed to visualize Microgateway performance from https://grafana.com/grafana/dashboards/12061
Configure Jaeger
Jaeger is the default distributed tracing system that is supported. There are many possible ways to deploy Jaeger and you can find more information on this link. Here we focus on all in one deployment with Docker.
- Install Jaeger via Docker and start the Docker container by executing the below command.
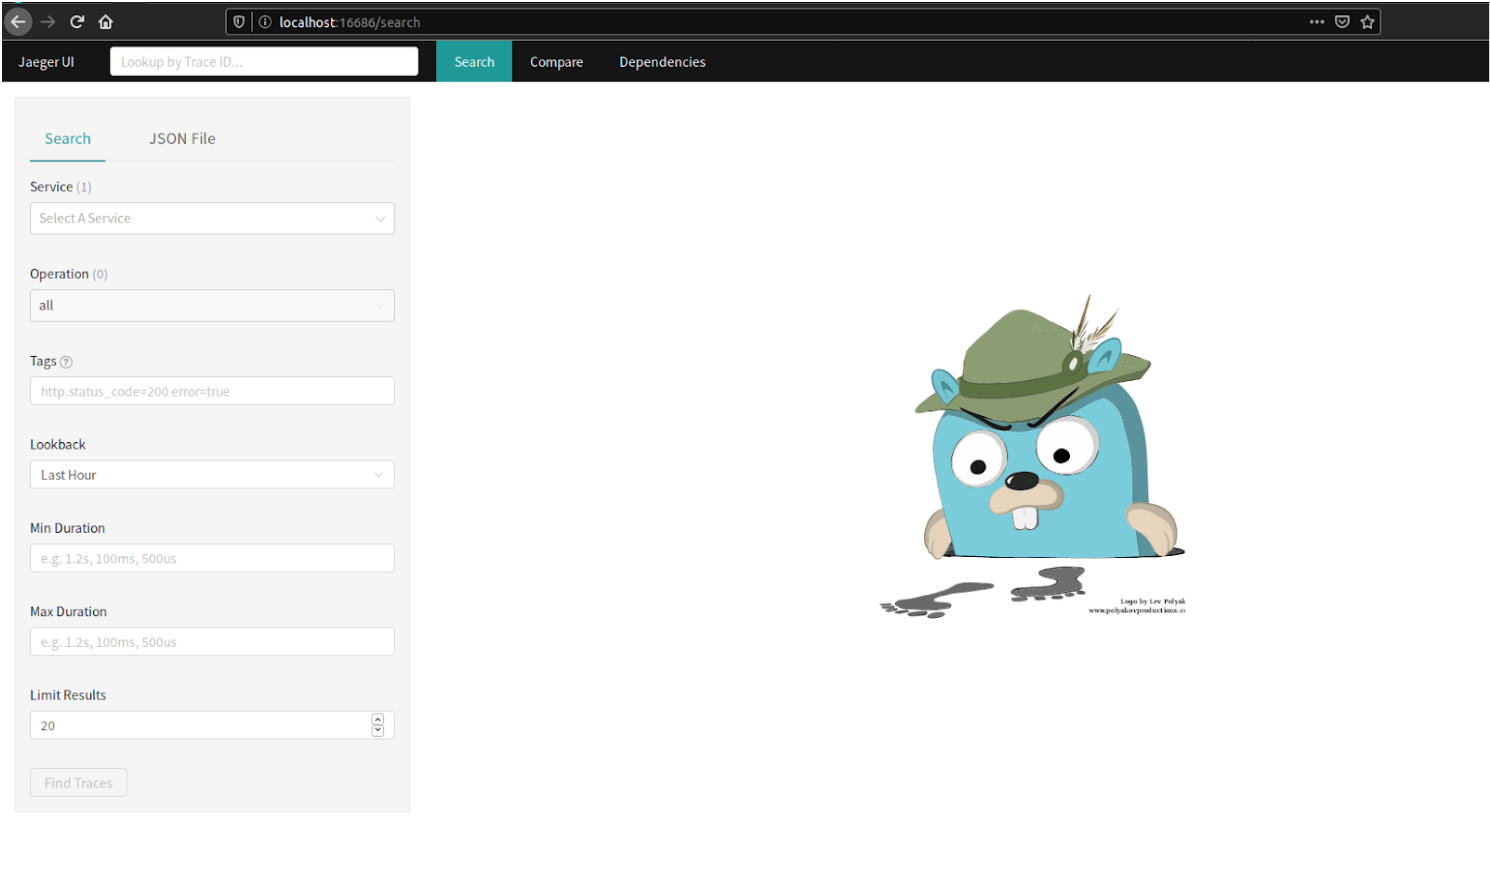
$ docker run -d -p5775:5775/udp -p6831:6831/udp -p6832:6832/udp -p5778:5778 -p16686:16686 -p14268:14268 jaegertracing/all-in-one:latest- Go to http://localhost:16686 and load the web UI of the Jaeger to make sure it is functioning properly.
Monitoring Metrix
Metrics, by default, supports Prometheus. In order to support Prometheus, an HTTPS endpoint starts with the contexts of /metrics and /jmxMetrics on default port 9000 is used. Here the endpoints are secured with Basic Auth. So you have to add a user and password in the microgateway conf file and use the same credentials to configure the Prometheus server also.
[b7a.users]
    [b7a.users.prometheus]
        password="@sha256:{5e884898da28047151d0e56f8dc6292773603d0d6aabbdd62a11ef721d1542d8}"
        scopes = "observability"
Prometheus.yml
global:
  scrape_interval:  15s
  evaluation_interval: 15s

  scrape_configs:
    - job_name: 'Ballerina_Metrics'
  basic_auth:
    username: prometheus
    password: 'password'
  scheme: https
  tls_config:
  insecure_skip_verify: true
  metrics_path: /metrics
  static_configs:
    - targets: ['10.100.4.38:9000']
    - job_name: 'JMX_Metrics'
  basic_auth:
    username: prometheus
    password: 'password'
  scheme: https
    tls_config:
      insecure_skip_verify: true
  metrics_path: /jmxMetrics
  static_configs:
      - targets: ['10.100.4.38:9000']
Metrics Configuration for Microgateway
This section focuses on the configurations that are available for metrics monitoring with Prometheus,and the sample configuration is provided below.
[b7a.observability.metrics]
    # Flag to enable Metrics
    enabled = true
    reporter = "prometheus"

[b7a.observability.metrics.prometheus]
    port=9797
    jmx_port = 8080
    secure_port = 9000
If you are using observability for several micro gateways, you only have to add different ports.
[b7a.observability.metrics.prometheus]
    port=9798
    jmx_port = 8081
    secure_port = 9001
Distributed Tracing
The sample configuration that enables tracing, and uses Jaeger as the sample tracer as provided below.
[b7a.observability.tracing]
    enabled=true
    name="jaeger"
The below table provides the descriptions of each configuration option and possible values that can be assigned.
| Configuration Key | Description | Default Value | Possible Values |
| b7a.observability.tracing.enabled | Whether tracing is enabled (true) or disabled (false) | false | true or false |
| b7a.observability.tracing.name | Tracer name which implements tracer interface. | jaeger | jaeger or zipkin |
Jaeger Client
Jaeger is the default tracer supported by Ballerina. Below is the sample configuration options that are available in the Jaeger.
[b7a.observability.tracing]
enabled=true
name="jaeger"
[b7a.observability.tracing.jaeger.sampler]
type="const"
param=1.0
[b7a.observability.tracing.jaeger.reporter]
hostname="localhost"
port=5775
[b7a.observability.tracing.jaeger.reporter.flush.interval]
ms=2000
[b7a.observability.tracing.jaeger.reporter.max.buffer]
spans=1000
The below table provides the descriptions of each configuration option and possible values that can be assigned.
| Configuration Key | Description | Default Value | Possible Values |
| b7a.observability.tracing. jaeger.reporter.hostname | Hostname of the Jaeger server | localhost | IP or hostname of the Jaeger server. If it is running on the same node as Ballerina, it can be localhost. |
| b7a.observability.tracing. jaeger.reporter.port | Port of the Jaeger server | 5775 | The port which the Jaeger server is listening to. |
| b7a.observability.tracing. jaeger.sampler.type | Type of the sampling methods used in the Jaeger tracer. | const | const, probabilistic, or rate limiting. |
| b7a.observability.tracing. jaeger.sampler.param | It is a floating value. Based on the sampler type, the effect of the sampler param varies | 1.0 | For const 0 (no sampling) or 1 (sample all spans), for probabilistic 0.0 to 1.0, for rate-limiting any positive integer (rate per second). |
| b7a.observability.tracing. jaeger.reporter.flush.interval.ms | Jaeger client will be sending the spans to the server at this interval. | 2000 | Any positive integer value. |
| b7a.observability.tracing. jaeger.reporter.max.buffer.spans | Queue size of the Jaeger client. | 2000 | Any positive integer value. |
Zipkin Client
The tracing of Ballerina service can be done via Zipkin as well, but the required dependencies are not included in default Ballerina distribution. Follow the below steps to add the required dependencies to the Ballerina distribution.
- Go to ballerina-observability and clone the GitHub repository in any preferred location. Make sure you have installed Apache Maven.
-
Open the command line and build the repository by using Apache Maven with the below command, while being in the root project directory ballerina-observability.
3. Go to the path - ballerina-observability/tracing-extensions/modules/ballerina-zipkin-extension/target/ and extract the distribution.zip file. 4. Copy all the JAR files inside the distribution.zip to ‘<project>/lib directory. 5. Change the following configuration name to Zipkin. This ensures that all tracers are sent to Zipkin instead of the default Jaeger tracer.mvn clean install
6. The following configuration is a sample configuration option available for Zipkin tracer.[b7a.observability.tracing] enabled=true[b7a.observability.tracing.zipkin.reporter] hostname="localhost" port=9411 [b7a.observability.tracing.zipkin.reporter.api] context="/api/v2/spans" version="v2" [b7a.observability.tracing.zipkin.reporter.compression] enabled=true